Overview
Long-term industry employment projections represent a valuable data source for those interested in future employment trends. Data are currently available for approximately 90 industries (at the 3-digit NAICS industry level).
Industry and occupational employment projections are estimates of expected future employment levels and growth rates. These projections contain a degree of uncertainty, as it is impossible to predict with precision future developments that may impact the labor market such as economic shocks or new technologies. Projections are updated every other year to incorporate new data and developments, among other updates. To assess future employment trends, we suggest focusing on the direction and relative size of projected changes, rather than on the precise value estimates.
Using the Dashboard
The dashboard below can be used to explore the data in multiple ways.
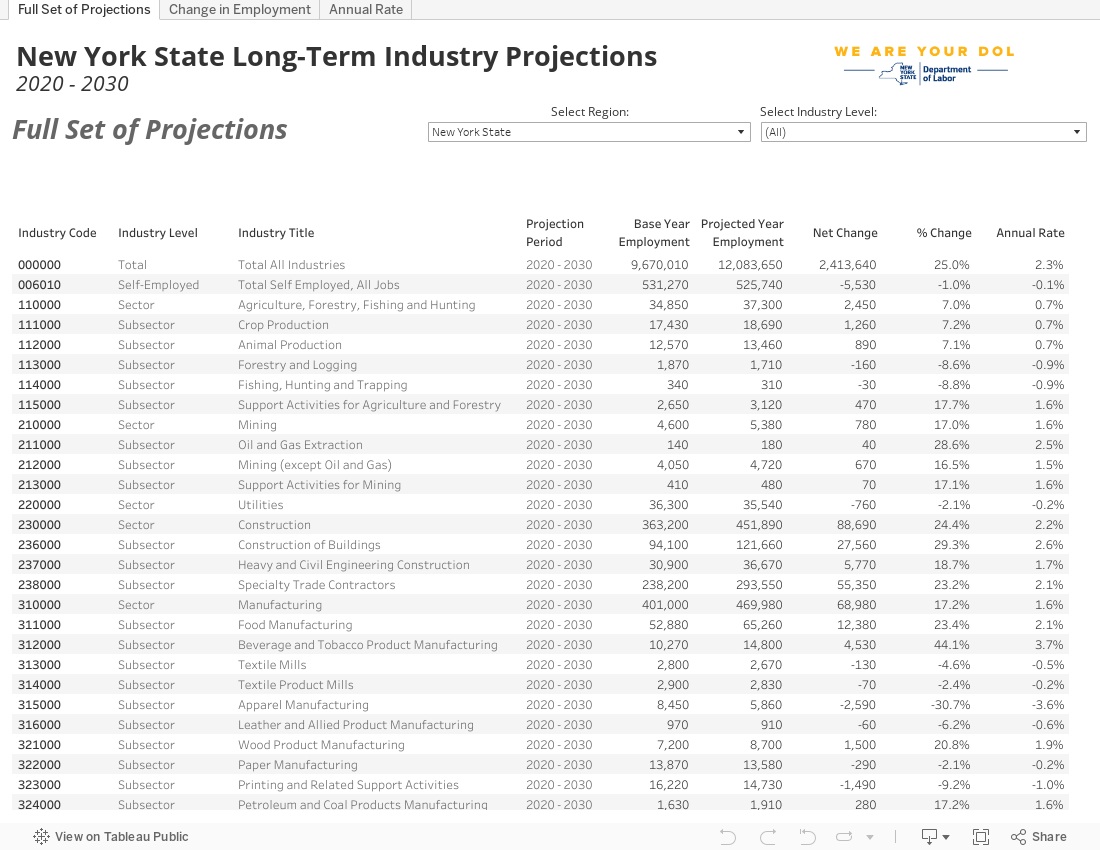
- Full Set of Projections – shows employment levels, net change, percent change, and annual rate change for all industries in New York State and its 10 labor market regions.
- Change in Employment – shows the net change and percent change in projected employment over the period in New York State and its 10 labor market regions for each industry.
- Annual Rate – shows the annual rate of change and in New York State, its 10 labor market regions, and the United States for each industry.
To learn more about how to use Tableau and download data, check out our guide Tableau Tips for the Web.
If you are having trouble accessing the data provided below because you are using assistive technology, please reach out to your local labor market analyst for assistance.
Questions regarding the long-term occupational projections should be directed to your local labor market analyst.
Long-Term Industry Projections
More Information
Statewide projections and Regional projections cover the 2020-2030 period. For additional information concerning Long-Term Industry Projections, see Technical Notes.