|
 by Steven Koczak, PhD, Research Specialist and Kevin Jack, Deputy Director
"People are more inclined to spend discretionary income on experiences rather than things."
Professor Michael Solomon, St. Joseph's University
Consumers have long been recognized as an important driver of the overall U.S. economy. This is understandable as consumer spending accounted for 65-70% of U.S. Gross Domestic Product over the past 25 years, per data published by the U.S. Bureau of Economic Analysis (BEA). The importance of the American consumer was recently underscored by an October 30, 2023 blog posting from the President’s Council of Economic Advisers which noted, “as the U.S. consumer goes, so goes the U.S. economy.”
While most people know that healthy consumer spending is a key contributor to economic and job growth in the U.S., what is less understood is how the mix of goods and services purchased by Americans has changed over time. Personal Consumption Expenditures data, which the BEA also publishes and calls the “nation's primary measure of consumer spending,” tell us how much money (also called “outlays”) consumers in the U.S. have spent on goods and services.
More Services, Less Goods
U.S. consumer spending on both goods and services has increased in absolute dollar terms since the end of World War II. However, expenditure patterns have changed dramatically as spending on services grew much faster than outlays for goods. As a result, the percentage share of total consumer spending devoted to goods has trended down, while the share of outlays for services has risen.
The last year consumers spent more on goods than on services was 1969. Today, about two-thirds of consumer spending is devoted to services. The list below shows the percentage breakdown between U.S. consumer spending on goods and services for selected years.
-
1946: 59.8% Goods, 40.2% Services
-
1960: 53.4% Goods, 46.6% Services
-
1980: 45.7% Goods, 54.3% Services
-
2000: 36.3% Goods, 63.7% Services
-
2022: 34.2% Goods, 65.8% Services
New York State’s goods and services breakdown is similar to that of the nation, though even more weighted towards services.
Pandemic Reverses Long-Term Pattern
Something strange occurred during the COVID-19 pandemic. According to BEA data, between the fourth quarter of 2019 and the second quarter of 2020 — the period that corresponds to the most-recent national recession — real (inflation-adjusted) consumer spending on services in the U.S. actually fell by 9.5%, the steepest two-quarter decline in the post-World War II era. Economists at Deloitte attribute this steep drop to social distancing, a shift to remote work and fears of the COVID-19 virus. Since the end of the pandemic, spending growth on goods (+27.9%) has continued to outstrip growth in services spending (+16.1%).
Introducing the “Experience Economy”
Some of the unique, and extravagant, gifts in this year’s Neiman Marcus Christmas Catalog include the opportunity to become a character in an animated Disney movie ($510,000), a nine-day treasure hunting excursion on a luxury sailing yacht in Bali ($485,000) and a chance to perform with the American Ballet Theater in New York City ($195,000). While these gifts are priced out of reach for the average American, they do underscore the fact that many consumers are increasingly seeking out personal services, including unique experiences.
In 1999, business writers Joseph Pine and James Gilmore published a book wherein they re-christened certain parts of the economy, primarily certain services, as the “Experience Economy.” They considered purchasable “experiences” to be a “distinct economic offering” from goods and services, which emerges when companies engage customers (“guests”) by using goods as props and services as a stage on which to display them. The result, essentially, is a purchased memory, and each “guest” by definition has purchased a different one.
Academic researchers have also looked into various facets of the “Experience Economy.” Bernd Schmitt, professor of marketing at the Columbia Business School, believes consumers are in search for experiences that ‘dazzle their senses,’ ‘engage them personally,’ ‘touch their hearts’ and ‘stimulate their minds.’ Those companies able to create personal experiences for customers will have a competitive edge.
Millennials (born between 1981 and 1996) currently comprise the largest share of New York’s workforce (36.3% in 2022) and are big consumers of experiences. According to research funded by Eventbrite and conducted by Harris during summer 2014, around 78% of surveyed Millennials said they’d prefer attending an event over buying a tangible good, and 72% had hoped to spend more on experiences in 2015 than they had in 2014. Even without updated data, or data on if they achieved their goal or not, the pattern is clear.
Examples of the Experience Economy
To some degree, the “Experience Economy” has been around for a long time. Amusement parks are sometimes considered the pinnacle of the “Experience Economy.” Amusement parks in the modern sense date to the late 1800s, when reliable, steam-powered mechanical rides emerged. Luna Park on Coney Island dates to the early 1900s.
The Empire State’s travel and tourism sector, which received a record 291.5 million visitors and generated $123 billion in total economic impact in 2022, has been a prime beneficiary of the ever-growing “Experience Economy.” For example, hidden in the rocks of Herkimer County in the Mohawk Valley are unusual geologic features that promote the growth of diamond-like crystals, often called “Herkimer Diamonds.” Businesses have sprung up nearby which allow one to purchase the rights to dig or mine for the “diamonds.” The businesses vary in how much they stress the overall experience.
From mid-2023 through early 2024, Schenectady Armory Studios held two interactive exhibits — one dedicated to Vincent Van Gogh and one to Claude Monet — aimed at visitors experiencing the art (achieved using various creative means) rather than just viewing it.
In New York City, RiseNY — which advertises “Experience New York like you've never seen before!” — primarily offers a virtual reality journey over, and through, the city’s skyline and various attractions. It also has or has virtual access to certain artifacts from various museums in the city, organized to showcase the city’s history, billing its “interactive” galleries as a way to maximize limited time in the city.
Conclusion
Nowadays, about two-thirds of consumption in the U.S. is dedicated to services rather than goods. The dominance of services over the past half century reversed what had been long-standing consumer spending patterns. One factor contributing to the rise of services has been the emergence of the “Experience Economy,” which has also boosted the state’s travel and tourism sector.
Offering experiences may afford businesses a competitive advantage, and already has done so for some. The experience of digging for Herkimer Diamonds or feeling as though one was inside art has given an edge to those who offer the experience versus those who don’t. Looking ahead, and if Harris’s 2014 research was correct, the promise of a unique experience, if nothing else, can be what helps to get the state’s 4.3 million Millennials through the door.
|
|
“Companies in the Southern Tier have a long and storied history in supplying our nation's military.”
|
|
|
by Christian Harris, Labor Market Analyst, Southern Tier Region
In last month’s newsletter, we analyzed total spending by the U.S. Department of Defense (DoD) in New York State. Overall defense spending consists of three main categories: defense contracts, defense grants and personnel (civilian, active military, and National Guard/Reserves).
To recap: New York ranked #5 in the nation in overall defense spending at $28.1 billion during federal Fiscal Year 2022 (FY2022). On a percentage basis, New York accounted for 5.0% of total defense spending in the U.S., while the Empire State ranked 32nd in terms of defense spending as a share of state GDP (1.4%) in FY2022.
In terms of individual spending categories, our state ranked #3 in the nation in terms of “defense grants” spending ($711.5 million), #4 in terms of “defense contracts” spending ($24.5 billion) and #17 in terms of “personnel” spending ($2.9 billion).
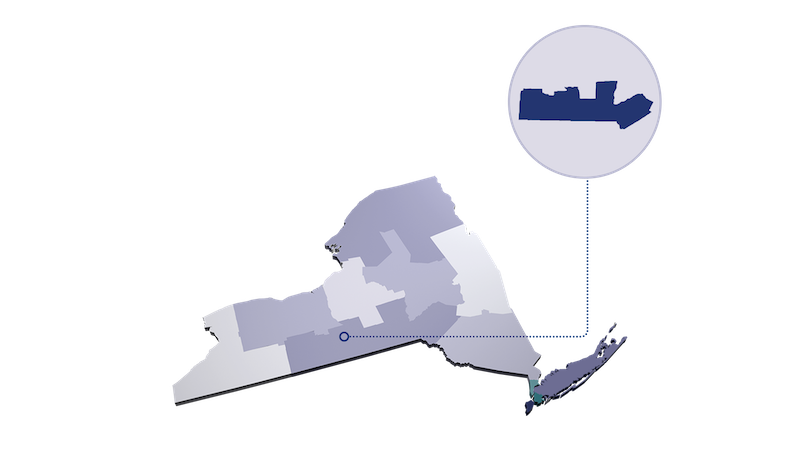
Valley of Opportunity
Economic growth in the eight-county Southern Tier region has long been driven by an above-average concentration of high-tech manufacturing employment, particularly jobs at electronics- and defense-oriented firms. For example, IBM was started in Endicott (Broome County) in 1911, while the Link Trainer, one of the first flight simulators used for pilot training, was developed by Link Aviation Devices in Binghamton (Broome County) in the late 1920s. The Link Trainer was the main pilot trainer used during World War II. It is estimated that they trained 500,000 Allied pilots, including almost all U.S. Army Air Forces pilots, during that war. The economic prosperity generated by these firms and others like them earned the Binghamton area the nickname “Valley of Opportunity.”
Complementing the region’s high-tech manufacturers is its highly educated workforce. The Southern Tier is home to several world-class universities, such as Cornell University in Ithaca (Tompkins County) and Binghamton University, which is one of the State University of New York system's four University Centers, in Broome County.
Regional Defense Spending
In federal Fiscal Year 2023, covering the October 2022-September 2023 period, the U.S. Department of Defense had an overall budget of $1.52 trillion, according to the USASpending.gov website. Of this total amount, the DoD earmarked just under $395 billion for the purchase of a wide array of goods and services offered by private sector vendors in the U.S.
Here, we use microdata from DoD contracts with individual prime contractors listed in the USASpending.gov database to analyze the scope of defense spending in the Southern Tier. Data from four federal fiscal years (FY2020 through FY2023) were aggregated. We also examine the counties and companies that were the largest recipients of DoD defense spending in the region.
Defense Spending by County
In FY2023, prime contractors in the Southern Tier received $742.6 million in DoD contracts. For the full four-year study period, Southern Tier firms received roughly $5.9 billion in DoD contracts, with every county in the region receiving some spending.
The list below shows, in descending order, prime contract spending received by firms in each Southern Tier county over the four-year study period (FY2020-FY2023), per our analysis of the USASpending.gov database. There was wide variation in the amounts received, ranging from $5.6 billion in #1 Tioga County to less than $1.0 million for #8 Schuyler County.
Value of Prime Defense Contracts, by County, Southern Tier, FY2020-FY2023
- Tioga ($5.6 billion)
- Broome ($231.5 million)
- Tompkins ($83.9 million)
- Chenango ($6 million)
- Delaware ($8 million)
- Chemung ($6.5 million)
- Steuben ($1.4 million)
- Schuyler ($0.98 million)
Tioga County is the clear standout, receiving more than 94% of total funding in the region. Other Southern Tier counties receiving at least $50 million in DoD contracts over the four-year study period were Broome at $231.5 million and Tompkins at $83.9 million.
Largest Defense Companies
Maryland-based Lockheed Martin is our nation’s largest defense contractor, per a recent analysis from Bloomberg Government. Their production site in Owego (Tioga County) received, by far, the most DoD spending in the region over the four-year study period. The Owego facility, which outfits military aircraft with advanced navigation instrumentation and tests the equipment, pulled in $5.5 billion in funding from FY2020 through FY2023.
The Maritime Helicopter Support Co. in Owego, which is a joint venture between Lockheed and Connecticut-based Sikorsky Aircraft, was in second place with $77.8 million in DoD contracts. Just behind in third place with $75.1 million in contracts was BAE Systems Inc., a subsidiary of a British multinational, which has a facility at the Huron campus in Endicott.
Broome County lays claim to six out of the 10 companies on the listing of top defense vendors in the region, followed by Tioga County’s two contractors. Tompkins and Chemung counties round out our list, respectively housing Ithaca-based GrammaTech, a spin-off from Cornell University that focuses on cybersecurity issues, and Elmira-based SEPAC, Inc., which manufactures and customizes clutches and brakes for a variety of applications.
The list below shows, in descending order, the 10 firms in the region that received the most prime contract spending from the DoD over the four-year study period.
Top Firms Receiving Prime Defense Contracts, Southern Tier, FY2020-FY2023
- Lockheed Martin Corp. ($5.5 billion), Tioga County
- Maritime Helicopter Support Co. ($77.8 million), Tioga County
- BAE Systems Inc. ($75.1 million), Broome County
- Innovation Associates, Inc. ($68.1 million), Broome County
- GrammaTech, Inc. ($63.4 million), Tompkins County
- Apex Pinnacle Corp. ($32.5 million), Broome County
- Aptim Federal Services ($15.0 million), Broome County
- Airborne Supply Inc. ($12.9 million), Broome County
- SEPAC, Inc. ($5.5 million), Chemung County
- BSC Partners LLC ($4.2 million), Broome County
Moving Forward
Companies in the Southern Tier have a long and storied history in supplying our nation’s military. Whether it was supplying nearly all of the shoes and footwear for the U.S. Army during World War I and World War II or outfitting advanced system controls on Marine One — the fleet of Marine Corps helicopters used to transport the U.S. president — the region remains an innovation hub for military goods and services. Going forward, DoD spending is expected to remain an important segment of the region’s economic base.
|
|
 At a Glance
In October 2023, New York State’s seasonally adjusted private sector job count decreased over the month by 10,300, or 0.1%, to 8,252,000. In addition, the state’s seasonally adjusted unemployment rate rose from 4.0% to 4.2% in October 2023, while New York’s seasonally adjusted labor force participation rate remained unchanged at 61.6%.
Capital
Over the past year, the private sector job count in the Capital Region rose by 7,900, or 1.8%, to 446,600 in October 2023. Job gains occurred in education and health services (+6,100), leisure and hospitality (+2,100), professional and business services (+1,700), financial activities (+400) and other services (+200). Losses were largest in trade, transportation and utilities (-1,200) and manufacturing (-1,000).
Central NY
The number of private sector jobs in the Syracuse metro area increased over the past year by 4,600, or 1.8%, to 264,100 in October 2023. Employment gains were greatest in professional and business services (+2,700), leisure and hospitality (+1,500), education and health services (+600) and other services (+300). Job losses were centered in manufacturing (-400) and information (-200).
Finger Lakes
From October 2022 to October 2023, the private sector job count in the Rochester metro area rose by 2,300, or 0.5%, to 452,900. Job gains occurred in education and health services (+7,400), other services (+400) and trade, transportation and utilities (+400). Losses were greatest in professional and business services (-3,500), leisure and hospitality (-1,100), natural resources, mining and construction (-500) and information (-400).
Hudson Valley
Over the past year, the number of private sector jobs in the Hudson Valley grew by 8,600, or 1.1%, to 810,200 in October 2023. Job gains were centered in education and health services (+12,200) and leisure and hospitality (+4,200). Employment losses were greatest in natural resources, mining and construction (-4,400), trade, transportation and utilities (-1,400), professional and business services (-800), financial activities (-600) and manufacturing (-500).
Long Island
For the year ending October 2023, private sector jobs on Long Island increased by 7,600, or 0.7%, to 1,154,600. Gains occurred in leisure and hospitality (+11,300), education and health services (+5,300), professional and business services (+1,600) and manufacturing (+1,200). Losses were greatest in trade, transportation and utilities (-4,800), natural resources, mining and construction (-4,500) and financial activities (-2,100).
Mohawk Valley
For the year ending October 2023, the number of private sector jobs in the Mohawk Valley increased by 100, or 0.1%, to 142,200. Over-the-year employment gains occurred in education and health services (+700) and leisure and hospitality (+500). Manufacturing (-500), trade, transportation and utilities (-400) and natural resources, mining and construction (-200) lost jobs over the past year.
New York City
The private sector job count in New York City rose over the past year by 89,000, or 2.2%, to 4,147,100 in October 2023. Job gains occurred in education and health services (+96,700), leisure and hospitality (+17,800), natural resources, mining and construction (+14,600), other services (+2,200) and financial activities (+1,900). Employment losses were centered in information (-28,100) and trade, transportation and utilities (-12,900).
North Country
From October 2022 to October 2023, the private sector job count in the North Country region increased by 1,400, or 1.3%, to 110,200. Over-the-year employment gains were greatest in leisure and hospitality (+900), education and health services (+300) and natural resources, mining and construction (+300). Over the past year, several sectors experienced small job losses.
Southern Tier
For the 12-month period ending October 2023, the number of private sector jobs in the Southern Tier decreased by 200, or 0.1%, to 218,300. Employment gains were greatest in education and health services (+800) and leisure and hospitality (+300). Over-the-year losses occurred in manufacturing (-600), natural resources, mining and construction (-500) and professional and business services (-300).
Western NY
Over the past year, private sector jobs in the Buffalo-Niagara Falls metro area rose by 4,500, or 1.0%, to 468,800 in October 2023. Gains were greatest in leisure and hospitality (+5,600), education and health services (+1,100), other services (+900), professional and business services (+900) and manufacturing (+800). Losses were largest in trade, transportation and utilities (-3,700) and financial activities (-700).
|
|
|
|
|